A climate zone is a place’s long-term pattern of temperature, precipitation, seasonality, and aridity, measured over 30-year intervals. That simple idea explains why a mountain can contain forest, meadow, and ice within a few kilometers, why South Florida differs from northern Florida, and why a garden label cannot answer a building-code question. Climate classification turns those patterns into a shared vocabulary for comparing ecosystems and the ways people live within them.
What a climate zone reveals about a place
Climate zones summarize conditions that recur over 30 years, not today’s weather. A rainy week does not make a desert non-dry, and a cold snap does not make a tropical coast temperate. Instead, the classification considers the long-term relationship among heat, rainfall, the timing of wet and dry seasons, and aridity.
Because climate strongly influences vegetation and other life, that relationship matters. For this reason, climate zones correlate closely with biome classification. Rather than naming the biome itself, a classification provides a compact description of the conditions that make certain vegetation patterns more likely.
The Köppen-Geiger climate classification is the most widely used framework. Using monthly temperature and precipitation thresholds, it divides the world into five primary groups, A through E, and 30 subclasses. At first, its codes can look cryptic, yet they compress three useful questions: What broad climate family is this? When does precipitation fall? How intense is summer or winter heat?
The five main climate zones make global patterns comparable
In the Köppen system, five main groups describe broad climate families. Their boundaries are based on measured thresholds, not on continent or political border. Before the smaller codes add detail, the table gives the essential distinction.
| Group | Core definition | Useful example |
|---|---|---|
| A: tropical | The coldest month averages 18 °C (64.4 °F) or higher. | Found within roughly 15–25° latitude of the equator. |
| B: dry | Potential evaporation exceeds precipitation. | Deserts and steppes; about a quarter of Earth’s land surface is dry climate. |
| C: temperate | The coldest month is between -3 °C and 18 °C, with at least one month above 10 °C. | Mediterranean, humid subtropical, and oceanic climates. |
| D: continental | At least one month falls below 0 °C (32 °F) and one rises above 10 °C (50 °F). | Chicago and Beijing are Dfa; Minneapolis and Moscow are Dfb. |
| E: polar | The warmest month remains below 10 °C (50 °F). | Tundra and ice-cap climates. |
Tropical and dry climates are not opposites
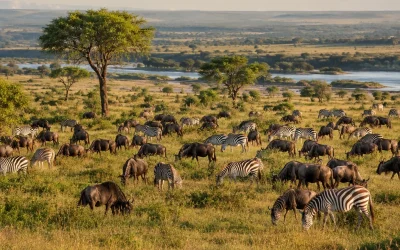
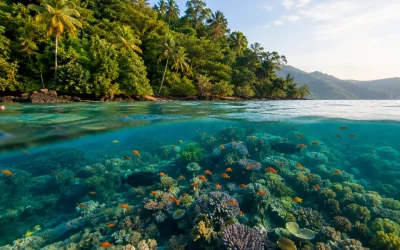
A tropical climate zone is defined by year-round warmth, while a dry climate is defined by water balance. That difference matters. Within Group A sit rainforest (Af), monsoon (Am), and savanna (Aw/As) climates. In Af climates, every month receives at least 60 mm (2.4 inches) of precipitation; Aw has a distinct dry winter and occurs across large areas of Africa, India, South America, and northern Australia.
For Group B, the question is different: does precipitation keep pace with potential evaporation? Below half of the aridity threshold, annual precipitation earns the code BW for desert; between 50 and 100 percent, it earns BS for semi-arid steppe. By this measure, the Sahara is hot desert BWh, while the Gobi is cold desert BWk.
Temperate, continental, and polar climates mark sharper seasonal contrasts
Within temperate Group C are Mediterranean Csa and Csb, humid subtropical Cfa and Cwa, and oceanic Cfb and Cfc climates. Continental Group D occurs mainly in the Northern Hemisphere between 40° and 55–60° north, where large landmasses limit the ocean’s moderating effect. It has a large annual temperature range and moderate precipitation that falls mostly in the warmer months. Winters bring snowstorms and bitter cold from polar or arctic air masses.
At the coldest end, polar Group E includes tundra ET, with at least one month above 0 °C but none above 10 °C, and ice cap EF, with no month above 0 °C. Köppen used the 10 °C summer isotherm as the tree-line boundary: forests cannot grow where the warmest month averages below it. Antarctica is the only continent where EF is predominant.
Köppen climate classification reads like a three-part code
German climatologist and amateur botanist Wladimir Köppen published the first version of his climate-zone map in 1884; the final version of his system appeared in 1936. Its original boundaries were designed to correspond with mapped vegetation zones, an empirical connection that still makes the system useful for cultural ecology and environmental anthropology.
In each code, the first letter is the broad group. The second letter describes precipitation seasonality: f means no dry season, s a dry summer, w a dry winter, and m monsoon. The third letter describes thermal intensity: a is a hot summer, with the warmest month at least 22 °C; b is a warm summer; c a cool summer; and d an extremely cold winter.
In Rome, Csa has a July average of 25 °C and summer rainfall that can drop to 20 mm. In Portland, Oregon, Csb has a July average of 19 °C and about 15 mm of rain. In London, Cfb has a July average of 13 °C, no pronounced dry season, and roughly 60 mm of rain each month.
Highland climate zones change as elevation rises
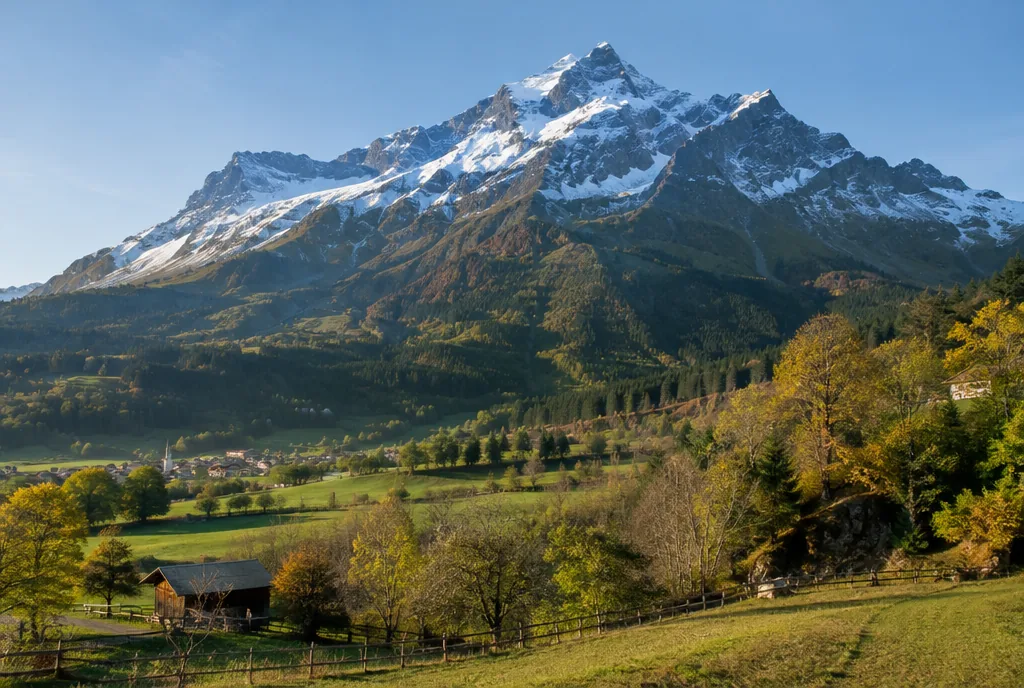
Some systems add Group H for highland climates. It was not part of Köppen’s original 1900 system; it is a supplementary category for mountains, where elevation rather than latitude drives the conditions. Temperature drops about 6.5 °C with every 1,000 meters of ascent, so a 4,000-meter peak near the equator can have polar temperatures at its summit.
From base to summit, one mountain can hold tropical forest, temperate woodland, alpine meadow, and permanent ice within a vertical span of a few kilometers. Another layer comes from aspect: south-facing slopes in the Northern Hemisphere receive more direct solar radiation and tend to be warmer and drier, while north-facing slopes retain moisture longer and support cooler-adapted vegetation.
This vertical zonation has social as well as ecological consequences. Major rivers including the Ganges, Yangtze, Colorado, and Amazon owe significant portions of their flow to highland precipitation and glacial melt. Mountains are often called the water towers of the world for that reason.
Find the climate zone that answers your specific question
Depending on the purpose, “What climate zone am I in?” has more than one valid answer. For a broad ecological climate classification, the interactive Köppen Climate Explorer lets users click a location. For U.S. location data, NOAA’s Climate Atlas accepts a city or ZIP code and provides maps of normals, anomalies, degree days, and threshold events.
- Use the Köppen Climate Explorer when the question is about global climate type, long-term temperature and precipitation patterns, or ecological comparison.
- Use NOAA’s Climate Atlas when a U.S. city or ZIP code needs local climate data.
- Use an IECC county lookup when the question concerns building requirements.
- Use the USDA Plant Hardiness Zone Map when the question is winter minimum temperature and plant survival; its ZIP lookup gives the relevant gardening zone.
A climate zone map is only useful once the purpose is clear. The Köppen Climate Explorer covers 1901 to 2099 with maps based on CMIP6 projections and offers a slider for comparing past, present, and future zones. For local normals and weather-related measures, NOAA’s U.S. maps serve another task.
IECC and USDA zones are not the same as Köppen zones
Köppen is a global, ecological system built on temperature and precipitation thresholds. In the United States, IECC/ASHRAE climate zones are building-code categories from Zone 1, very hot, through Zone 8, subarctic. They are defined by heating and cooling degree days and assigned by county, not by state.
After the number, IECC zones may add A for moist, B for dry, or C for marine. A code such as 4A means mixed-humid; 3B means hot-dry. These labels determine prescriptive energy-code requirements for insulation R-values, window U-factors, solar heat gain coefficients, and vapor-retarder placement. Because cold dominates design decisions, Zones 7 and 8 have no moisture suffix.
USDA hardiness zones answer a narrower gardening question. The 2023 USDA map divides the United States into 13 zones in 10 °F bands, each with “a” and “b” subzones in 5 °F increments, based on average annual minimum winter temperature. It helps identify winter survival risk for plants; it does not replace a climate classification based on rainfall and summer heat.
Florida proves that a state can hold more than one climate
Florida spans two Köppen regimes. Most of the state is humid subtropical Cfa, while South Florida and the Florida Keys are tropical savanna Aw. The Miami metropolitan area, southwest Florida from Fort Myers southward, and all of the Florida Keys qualify as tropical Aw.
Building zones draw a different map across the same state. Miami-Dade County is IECC Climate Zone 1A, very hot-humid, while much of northern Florida is Zone 2A. The contrast shows why a statewide label can mislead: Köppen, IECC, and USDA systems may all be useful at the same location, but each answers a different practical question.
Human adaptation begins with local climate patterns
People adapt not simply to temperature but to its interaction with water, seasonality, and terrain. Inuit communities in the Arctic rely on hunting and fishing, including ice fishing and seal hunting. In dry regions, cultures developed irrigation systems, terraced farming, and drought-resistant crop varieties.
Buildings record similar adaptation. Thick adobe walls in hot-dry zones use thermal mass. Stilted houses in humid tropical settings encourage ventilation. Steeply pitched roofs in snowy continental regions respond to snow. Agriculture also tracks climate niches: wheat and barley thrive in temperate climates, while bananas and pineapples suit tropical climates. In both settings, farmers face distinct pressures from pests, soil erosion, and unpredictable weather.
Climate change is shifting the boundaries people rely on
Under high-emission RCP8.5 scenarios, CMIP6 projections indicate that tropical Group A and arid Group B regions expand while polar Group E contracts. The largest population exposure to climate-zone shifts occurs in densely populated temperate regions projected to be reclassified as tropical, including parts of northern India, northern Vietnam, southeastern China, and the East African Rift Valley.
Protected land is not fixed in climatic terms: around 20 percent of global protected land area is projected to undergo Köppen climate-zone shifts by mid-century under all future scenarios. For communities, this means that classifications are useful baselines rather than permanent labels. The same map that explains established vegetation can also help reveal where conditions are changing.
Common misunderstandings make climate zones less useful
Myth: A climate zone predicts today’s weather
It does not. A climate zone describes long-term averages and recurring seasonal patterns over 30 years, not a particular storm, cold front, or heat wave.
Myth: Every state belongs to one climate zone
Florida’s Cfa and Aw regions show why this fails. IECC zones are even assigned by county, and Illinois spans Zones 4 and 5; Cook County, including Chicago, is 5A, cool-moist.
Myth: A USDA hardiness zone is a complete climate description
USDA zones are based on average annual minimum winter temperature. They are valuable for plant selection but do not classify precipitation seasonality, aridity, or summer heat.
Frequently Asked Questions
What is a climate zone?
A climate zone is a geographic region defined by long-term, 30-year patterns of temperature, precipitation, seasonality, and aridity. It describes climate, not day-to-day weather.
What are the main climate zones of the world?
The five main Köppen groups are A tropical, B dry, C temperate, D continental, and E polar. Some systems also use H for elevation-driven highland climates.
What climate zone am I in?
For a Köppen answer, use a click-location map such as the Köppen Climate Explorer. For U.S. climate data, search a city or ZIP code in NOAA’s Climate Atlas; use county and ZIP tools for IECC and USDA questions.
What climate zone is Florida in?
Most of Florida is humid subtropical Cfa. South Florida and the Florida Keys are tropical savanna Aw, including the Miami metropolitan area and southwest Florida from Fort Myers southward.
How do the Köppen classification and U.S. climate zones differ?
Köppen classifies global climates through temperature and precipitation thresholds. IECC zones are U.S. building-code categories based on heating and cooling degree days, while USDA hardiness zones measure average annual minimum winter temperature for gardening.